Godfrey Pachavo
Last update: 18 March 2014
Summary
Background
The GLTFCA includes state protected wildlife areas, conservancies, and small scale commercial farming areas as well as large scale commercial farming areas and surrounding communal lands.
The relationship between ecosystem goods and services ( as indicated by levels of net primary productivity (NPP)) and patters of land-use and land tenure within the GLTFCA are unknown yet have a direct bearing on issues of sustainable development, human livelihoods, biological conservation, and the management of disease and ecosystem health.
Important overarching question concerning the long term development and sustainability of the GLTFCA are:
What is the distribution of NPP (a proxy for ecosystem goods and services) in the GLTFCA?
How does NPP vary seasonally and annually in relation to soils, topography, land use and land tenure?
Providing answers to these questions will lay a basis for answering questions about links between ecosystem goods (e.g. arable soils, timber, grazing, water, shelter) and services, wildlife, livestock and human well-being in the GLTFCA.These are issues of central importance to the long term development and sustainability of the GLTFCA and the mostly small scale communal farmers living within its boundaries.
Abstract
In modeling NPP we used a non-destructive, remote sensing approach as established by Rahman, et al (2004) based on the Monteith Equation (Monteith, 1977).
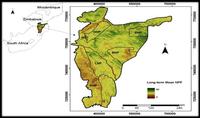
We present how remote sensing (RS) methods are being developed to estimate “continuous field” light use efficiency (LUE) with simpler measures based on xanthophyll cycle. We present results on how we estimate NPP over the GLTFCA terrestrial ecosystems using a freely available MODIS imagery, as well as GIS shortwave radiation model derived absorbed photosynthetically active radiation (APAR) term a pre-requisite in the modelling of NPP in this study. The NPP was estimated in grams of carbon per square metre per month (gC m-2 mon-1).
Results of this study indicate that:
- We can use remote sensing to estimate NPP in savannah landscapes
- Different land-use/land tenure types explain differences in NPP across the GLTFCA
- Mean NPP is highest in large-scale commercial farming areas (LSCFAs) followed by national parks (NPs) while the communal lands (CLs) have the least NPP
- Rainfall and soil type are key biophysical factors helping to explain spatial and temporal NPP patterns within the GLTFCA with a strong correlation between NPP and rainfall.
- Differences in NPP amongst the NPs (same land-use/land tenure system) within the GLTFCA
Last update: 18 March 2014


